AEX Short Term Update
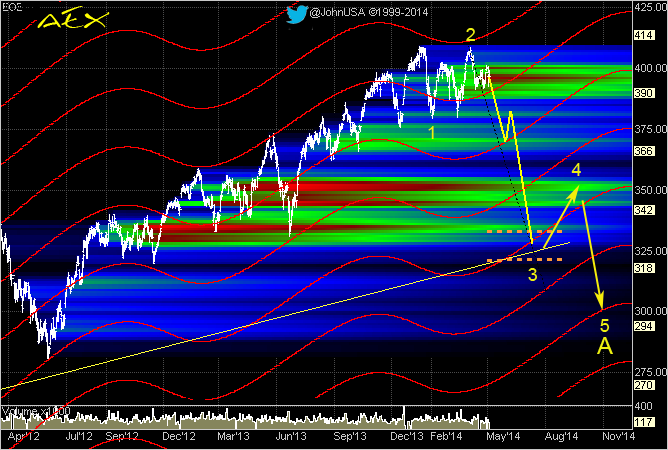
Frequent readers know what's going on. Please read the previous articles to see what's going on here. In order for the longer term 'working model' to stay valid, the AEX needs to decline very soon…
Subject
15 dispatches.
Frequent readers know what's going on. Please read the previous articles to see what's going on here. In order for the longer term 'working model' to stay valid, the AEX needs to decline very soon…
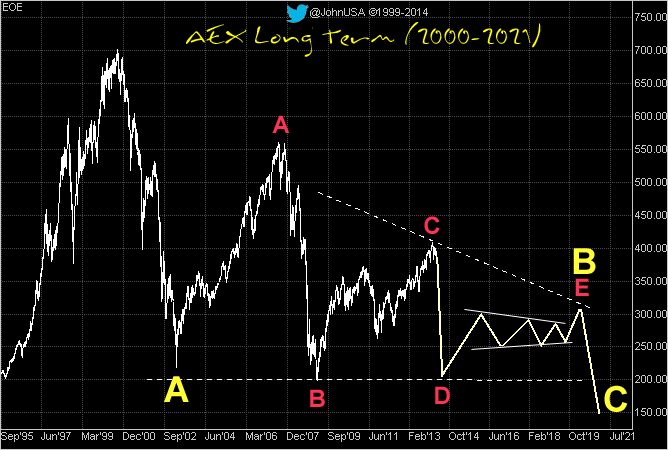
4 Charts, starting at Long Term, going to Short Term. The first chart (long term) has been discussed in earlier posts on this site. Medium Term the AEX started wave D (red) on Jan 15th ,2014. The…
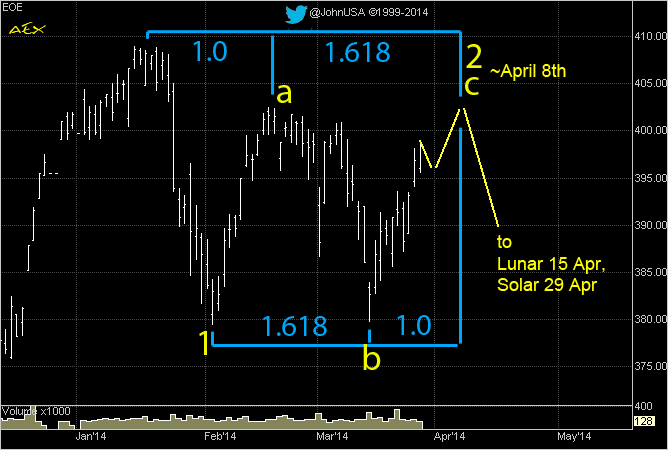
A brief update on what *might* unfold over the next several days. The AEX appears to be completing a corrective Flat (a-b-c) which is retracing the wave 1 decline that started in January. A possible…
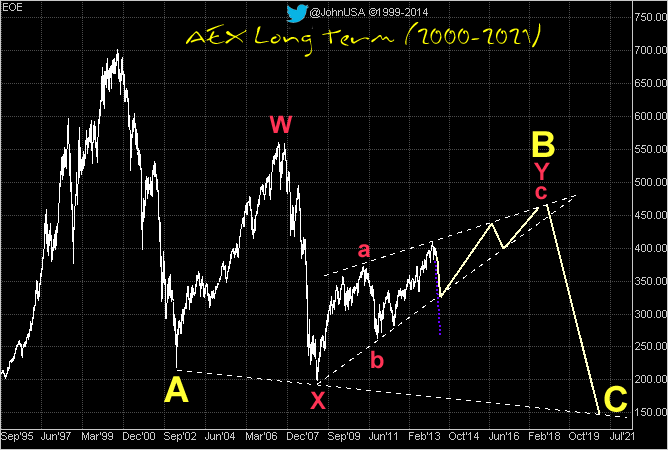
The AEX made a recovery high on Jan 15th, while the DOW made an ATH on Dec 31st. This is (so far) still consistent with a predicted high in 2013. See DOW chart at the bottom. It's interesting that…
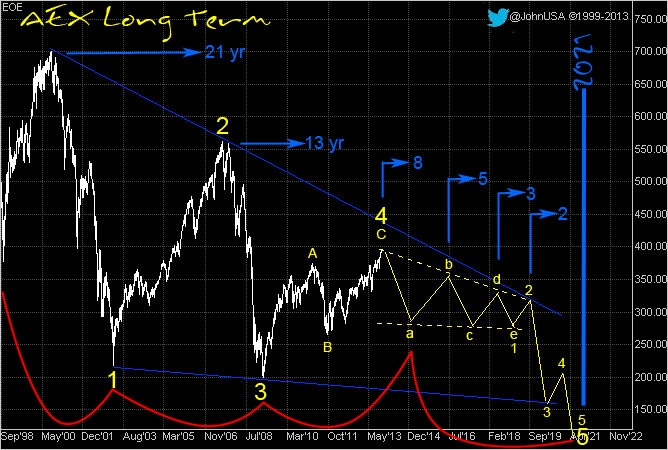
Time for an update on the long term chart. The chart below is slightly adjusted from the June update, but the concept stays the same. Unlike the DOW Jones, which is setting all time highs at each…
· 3 replies
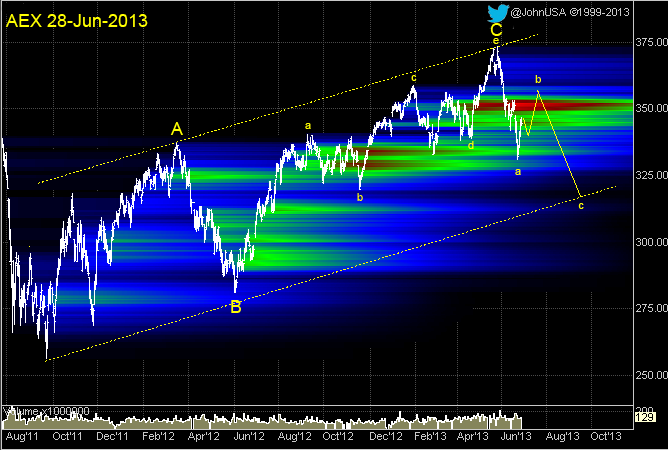
To keep things in perspective it is good to keep the long term outlook in mind. I do this in this post. First a bit of short term. The AEX is currently retracing a decline. Over the next several…
· 1 reply
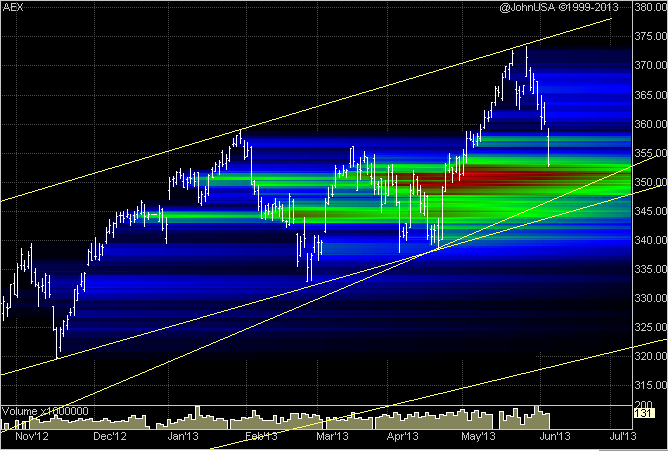
The 7 trading days since the top brings the AEX right at the previously projected first area of support. See image. While the decline looks straight on this chart (like an impulse) on the intraday…
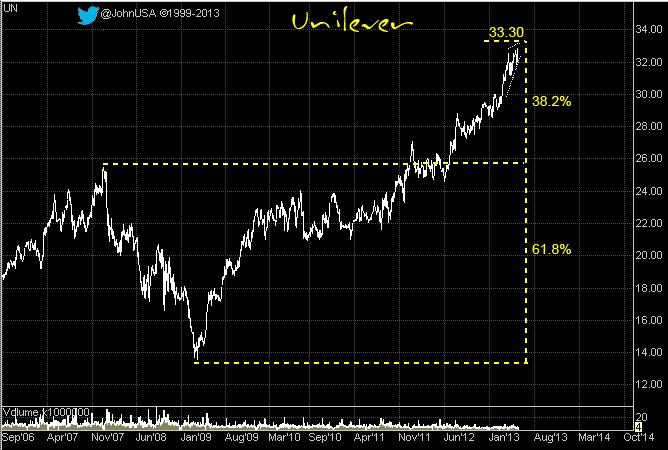
Unilever is approaching a Fibonacci price relationship at 33.30. See chart. Zooming in (see chart below), Unilever's uptrend is weakening. One indication of an ending diagonal is decreasing volume…
· 1 reply
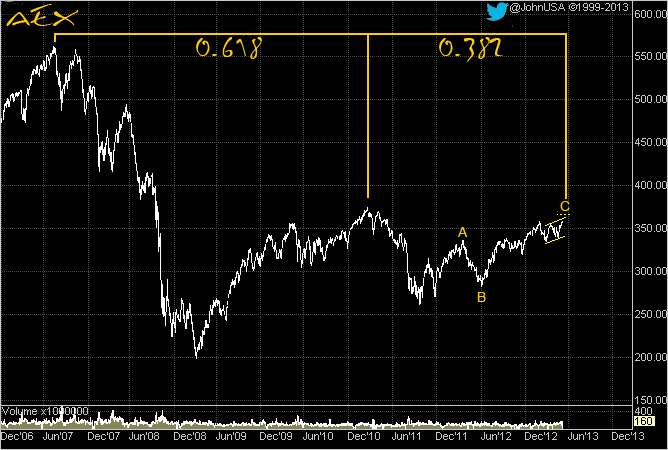
The AEX is completing a large 3-3-5 Flat pattern according to the Elliott wave principle that started at the low in Feb '09. A large Fibonacci time ratio indicates a potential turn date at May 10th…
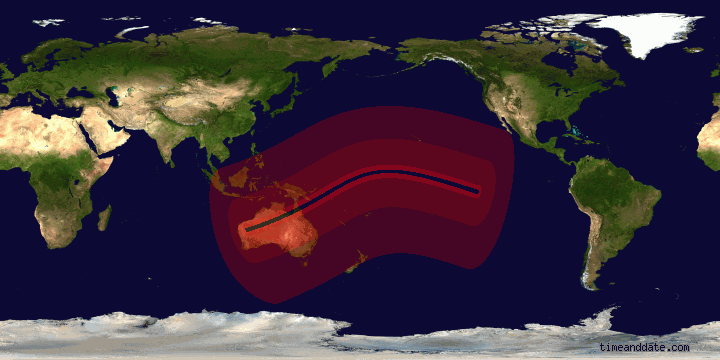
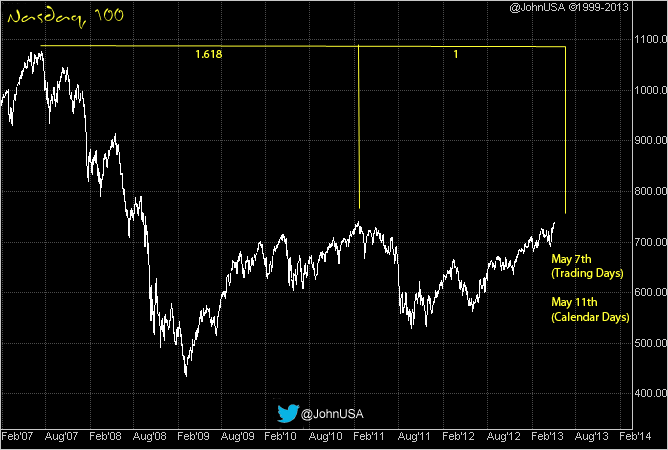
The Nasdaq 100 index is now in a Fibonacci time frame between May 7th and May 11th. See chart. This coincides with a Solar eclipse on May 9 (May 10 in Europe). A good time to take some profits?
· 1 reply
Just a quick note here. the Nasdaq 100 index might be entering a Fibonacci time frame between May 7th and May 11th. See chart.
· 4 replies
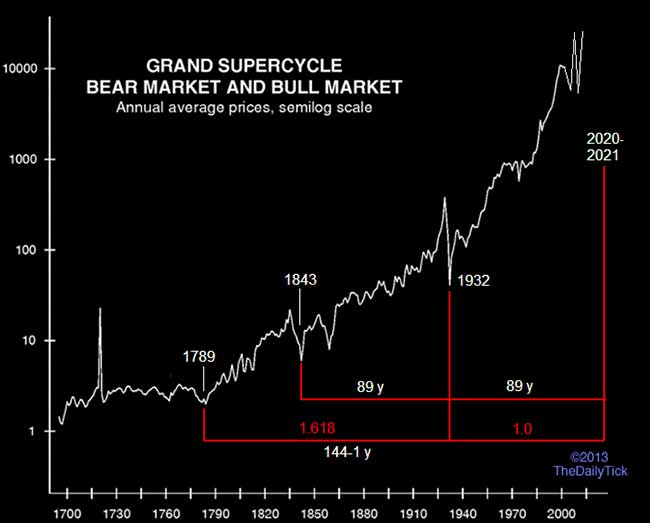
DOW Jones Industrial & Fibonacci To look at important turning points in the market, it often helps to use Fibonacci time ratios. In the chart below I use a very(!) long term price chart. By taking…
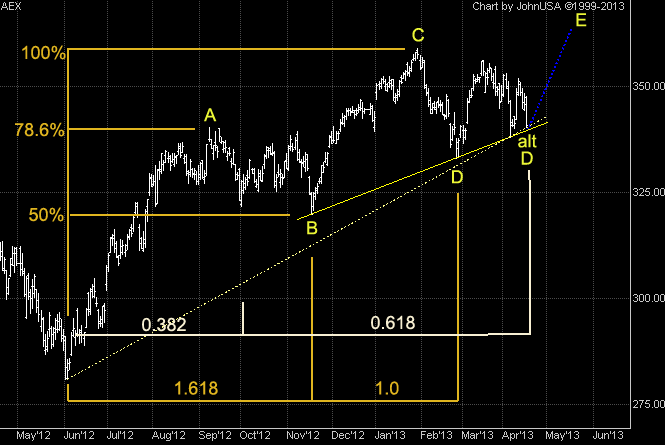
The AEX counts best as an ABCDE ending diagonal that needs 1 more leg up. See the April 12 article . Wave D either ended in February or is ending right now, in which case wave D is a triangle…
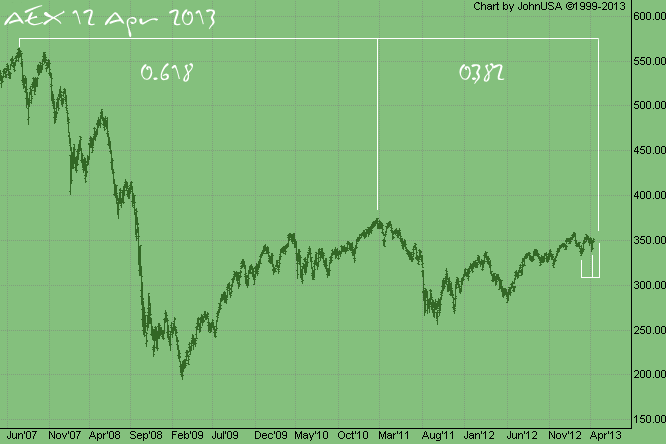
The AEX is on its way to an important Fibonacci time relationship date. Note two important highs, 13-Jul-2007 and 18-Feb-2011. Using a standard 61.8% (golden ratio) and applying it to the 2 tops, we…
The short answer is "No", not by a long shot. As I have said earlier, I think the market will only bottom in 2021 and in this article I will explain why I believe that. To look at important turning…