AEX short Term Update
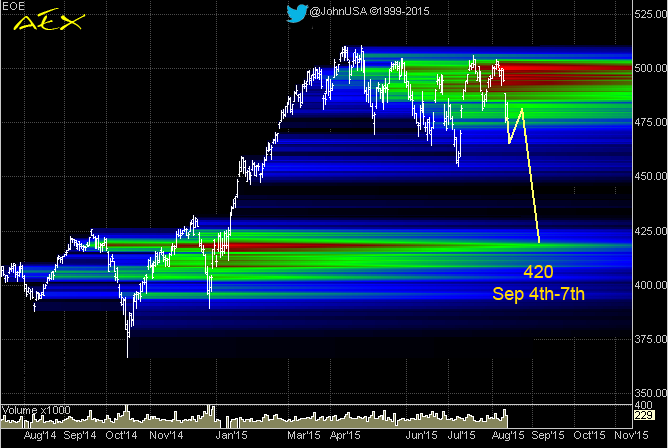
This is my current working hypothesis. AEX going to 420 in the first week of September. Why? Well, there's a number of indications, most of them not shown on the chart. In short, several (Fibonacci)…
A closed archive · 2013–2015
The Daily Tick was a trading journal: AEX options, Elliott wave counts, Fibonacci cycles, and the stubborn idea that planetary transits show up in the tape. Written by John Boere between 2013 and 2015, and preserved here exactly as published.
This is my current working hypothesis. AEX going to 420 in the first week of September. Why? Well, there's a number of indications, most of them not shown on the chart. In short, several (Fibonacci)…
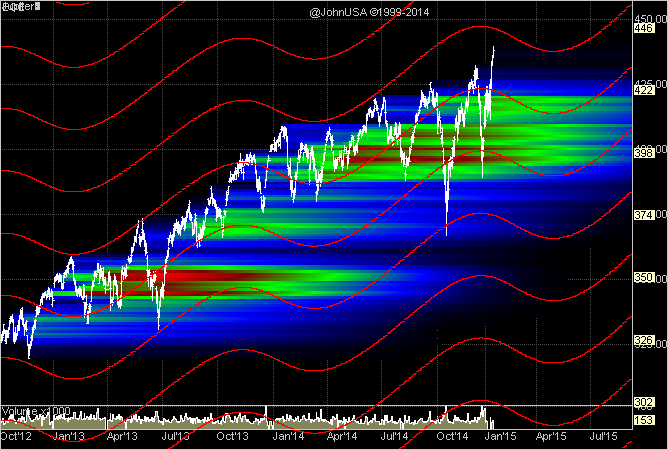
As reported on Twitter ( @johnusa ) yesterday, the AEX (see image) was fast approaching one of its Jupiter lines (red) at around 446. As history has shown, this is often a point of reversal. If this…
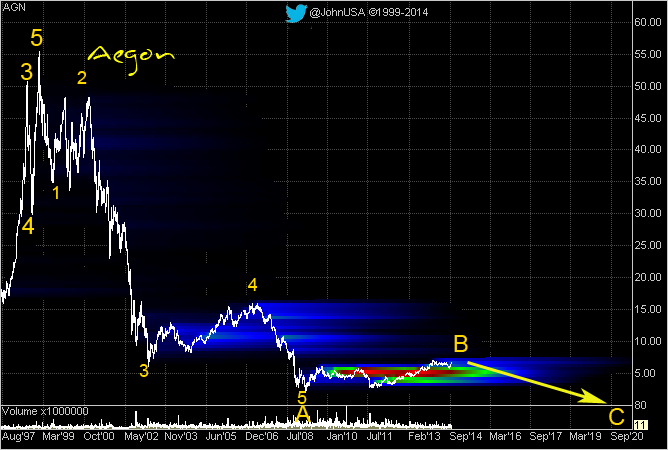
It has been a long time since the last update. This doesn't mean lack of activity, several brief posts have been posted on Twitter @JohnUSA . Today, instead of the usual AEX updates, here are some…
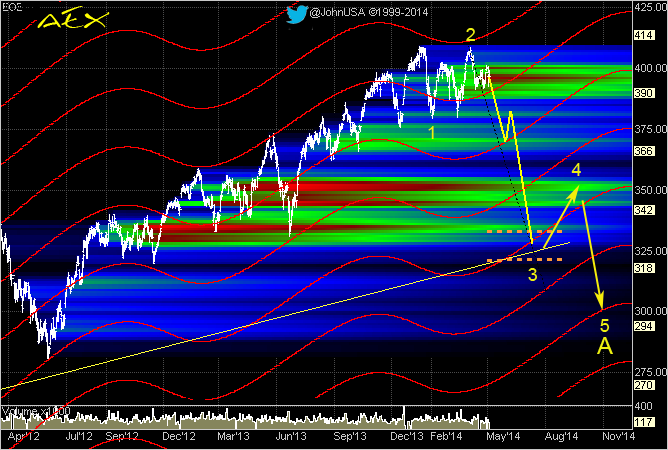
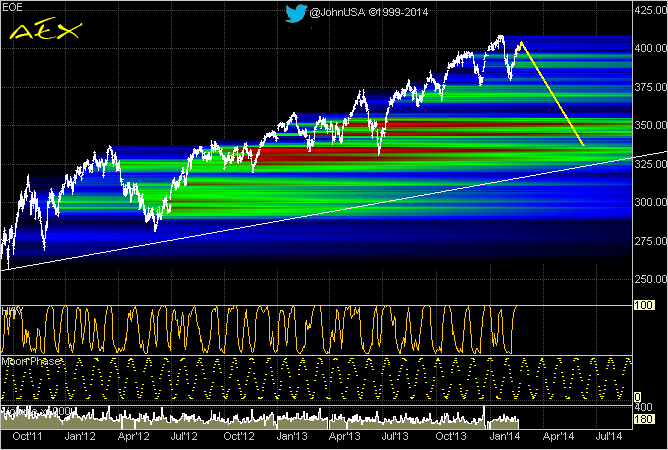
Frequent readers know what's going on. Please read the previous articles to see what's going on here. In order for the longer term 'working model' to stay valid, the AEX needs to decline very soon…
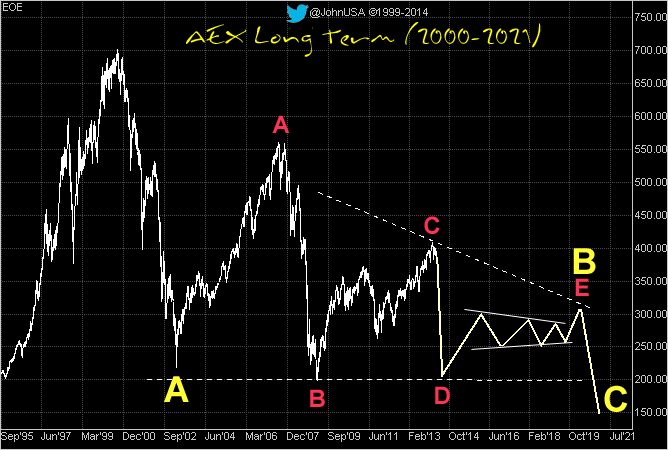
4 Charts, starting at Long Term, going to Short Term. The first chart (long term) has been discussed in earlier posts on this site. Medium Term the AEX started wave D (red) on Jan 15th ,2014. The…
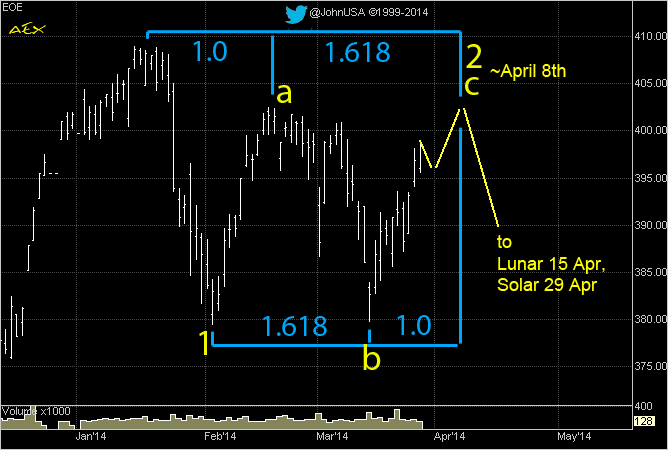
A brief update on what *might* unfold over the next several days. The AEX appears to be completing a corrective Flat (a-b-c) which is retracing the wave 1 decline that started in January. A possible…
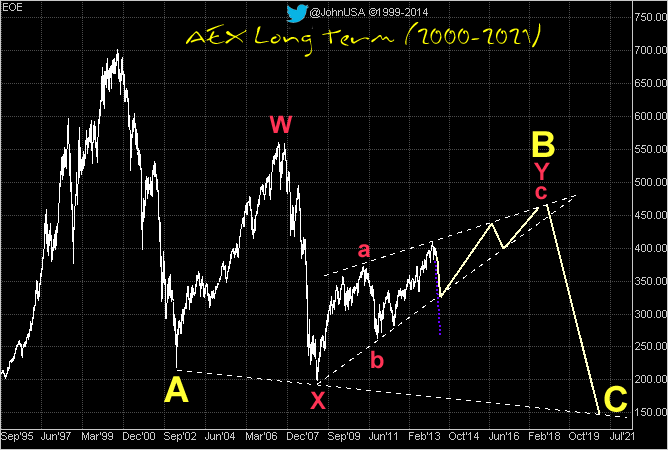
The AEX made a recovery high on Jan 15th, while the DOW made an ATH on Dec 31st. This is (so far) still consistent with a predicted high in 2013. See DOW chart at the bottom. It's interesting that…