The ledger
Archive
All 52 dispatches, newest first. Dates are as originally published.
2015
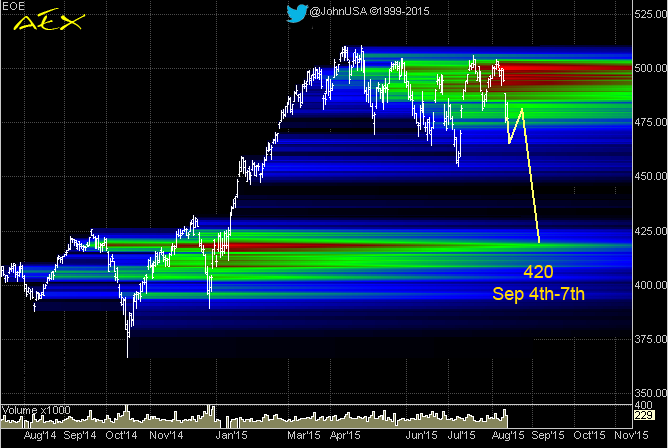
2 entries- AEX short Term UpdateThis is my current working hypothesis. AEX going to 420 in the first week of September. Why? Well, there's a number of indications, most of them not shown on the chart. In short, several (Fibonacci)…
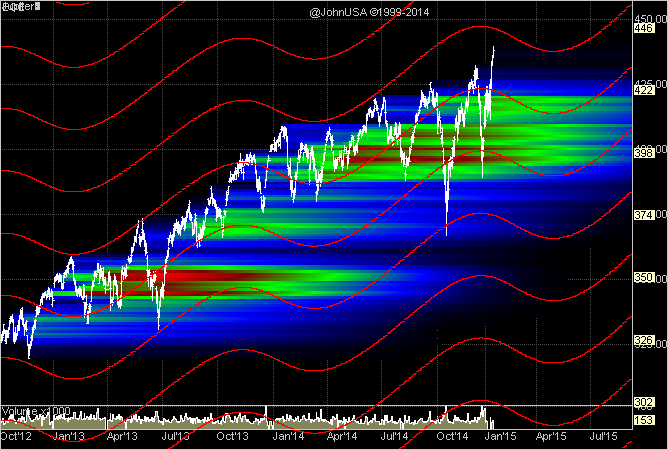
- Intraday Setup 101As reported on Twitter ( @johnusa ) yesterday, the AEX (see image) was fast approaching one of its Jupiter lines (red) at around 446. As history has shown, this is often a point of reversal. If this…
2014
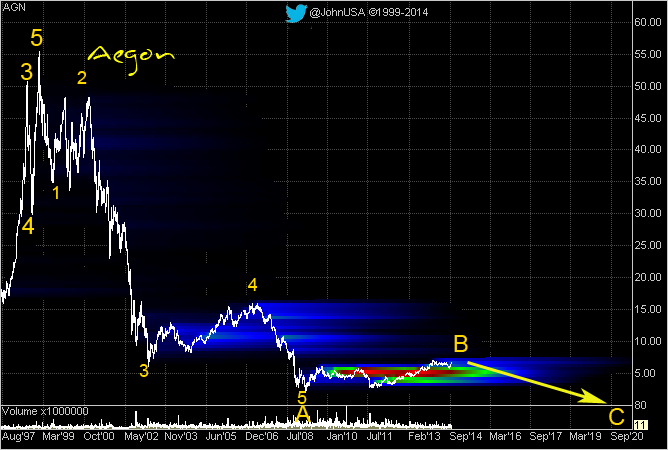
9 entries- AGN, ASML, BEL20, HEI, ING, KPN, PHI, TPG, UN long term updatesIt has been a long time since the last update. This doesn't mean lack of activity, several brief posts have been posted on Twitter @JohnUSA . Today, instead of the usual AEX updates, here are some…
- AEX Short Term UpdateFrequent readers know what's going on. Please read the previous articles to see what's going on here. In order for the longer term 'working model' to stay valid, the AEX needs to decline very soon…
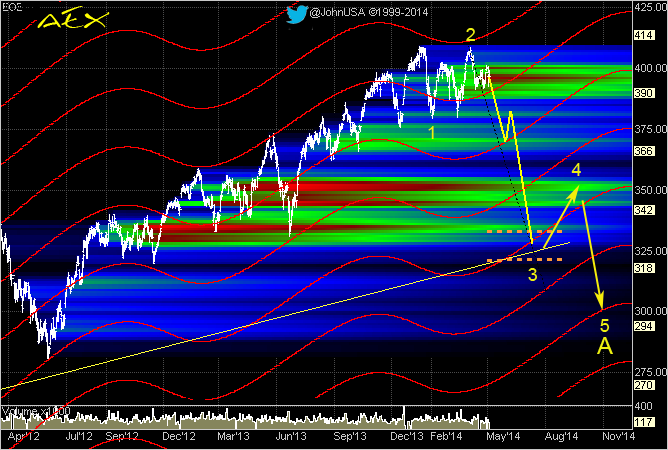
- AEX Short, Medium, Long Term Update4 Charts, starting at Long Term, going to Short Term. The first chart (long term) has been discussed in earlier posts on this site. Medium Term the AEX started wave D (red) on Jan 15th ,2014. The…
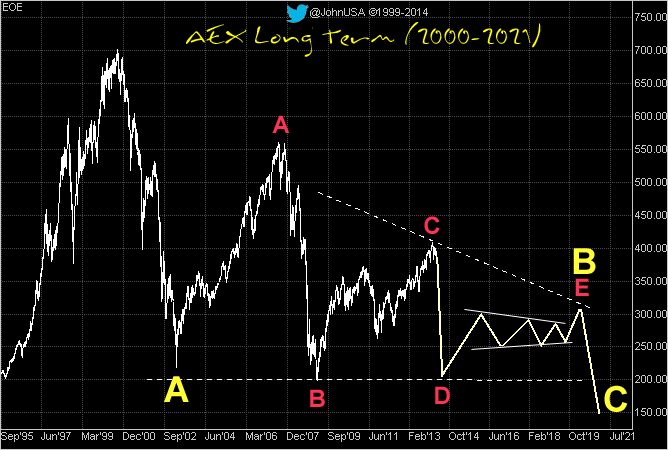
- AEX Short Term UpdateA brief update on what *might* unfold over the next several days. The AEX appears to be completing a corrective Flat (a-b-c) which is retracing the wave 1 decline that started in January. A possible…
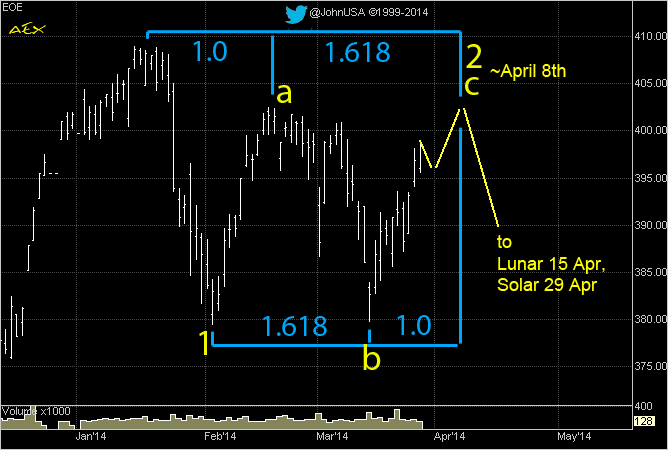
- AEX Long Term Thoughts & ScribblesThe AEX made a recovery high on Jan 15th, while the DOW made an ATH on Dec 31st. This is (so far) still consistent with a predicted high in 2013. See DOW chart at the bottom. It's interesting that…
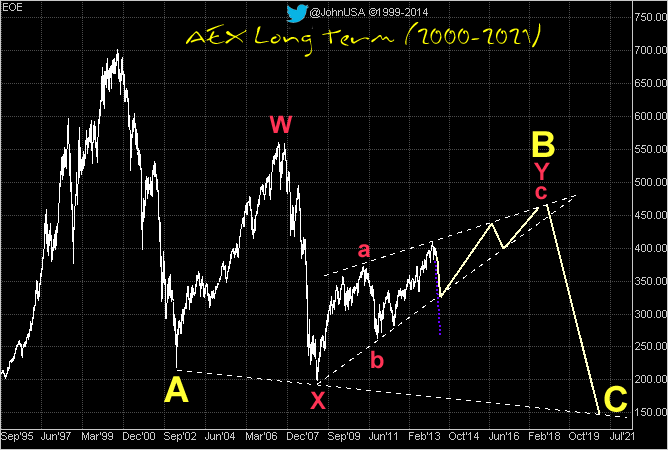
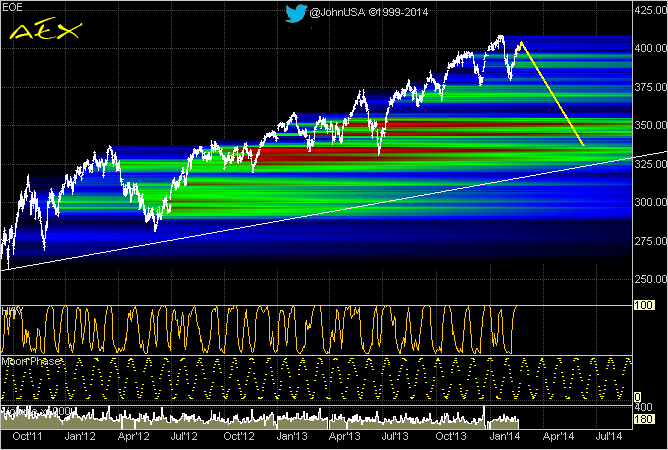
- AEX toppyShown is the AEX with a modified Stochastics, the Moon Cycle (Sine wave) and Volume. Volume is dropping, indicating a weakening (up)trend. Stochastics is entering overbought territory. The next New…
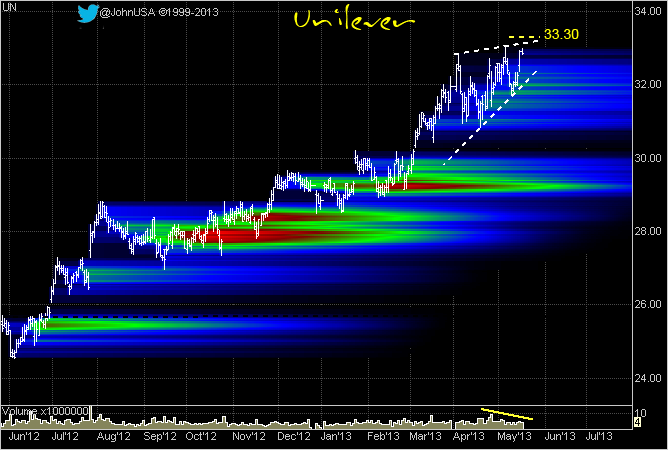
- Unilever Update: Nailed itBelow is the Unilever chart from May 2013. See this post for full article. While UNI didn't reach the 33.30 target (it stopped at 33.09) it has since made an impressive 18% decline at the Oct 2013…
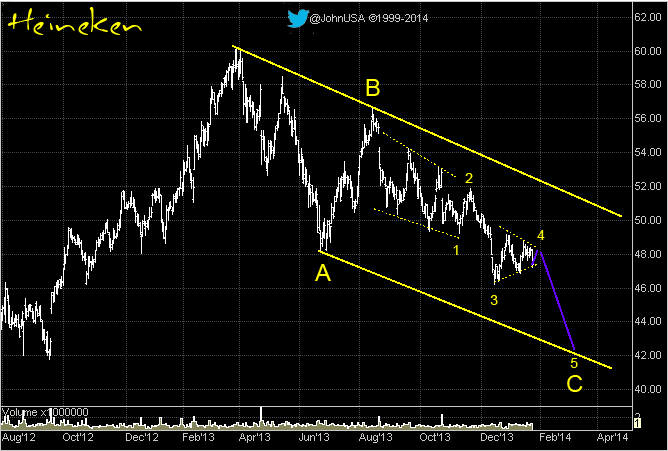
- Heineken Short Term UpdateHeineken shows multiple patterns that it justifies its own post today. Since the top in March last year, HEI appears to be completing an A-B-C corrective pattern. Since A and B look like a 3-wave and…
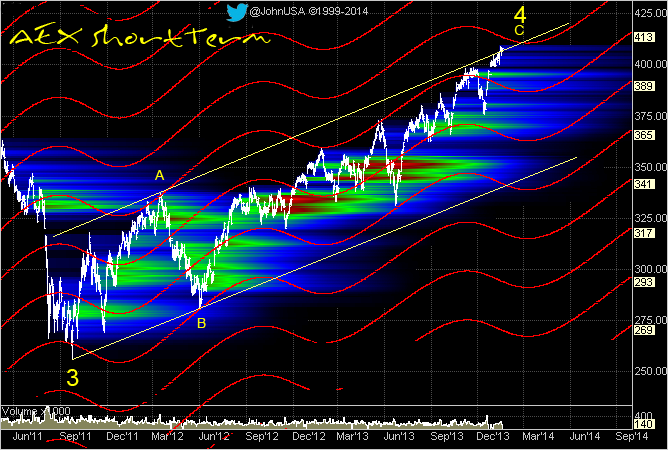
- AEX closing in on targetThe AEX has reached the upper trend-line dating back to 2011. So far, ALL important reversals in the past several years hit the Jupiter lines (explained here ) either intraday or end-of-day (red wave…
2013
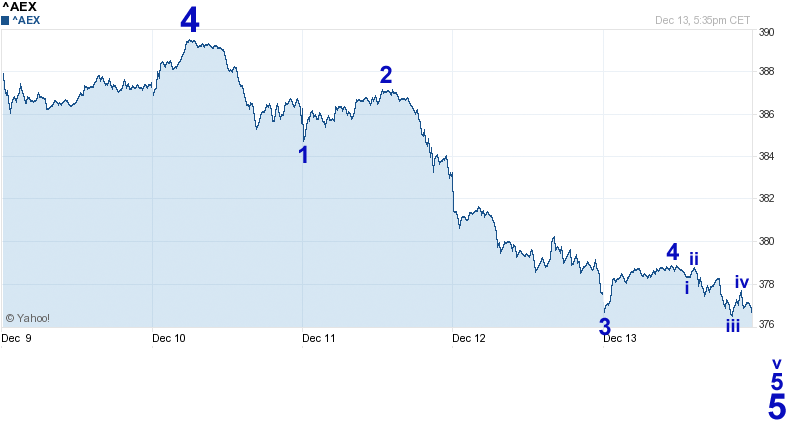
41 entries- AEX Short Term UpdateThe AEX is finishing a small degree 5 wave that should bottom Monday (at least 375?), or early in the week. This move is part of a larger impulse wave that started in the second half of November. If…
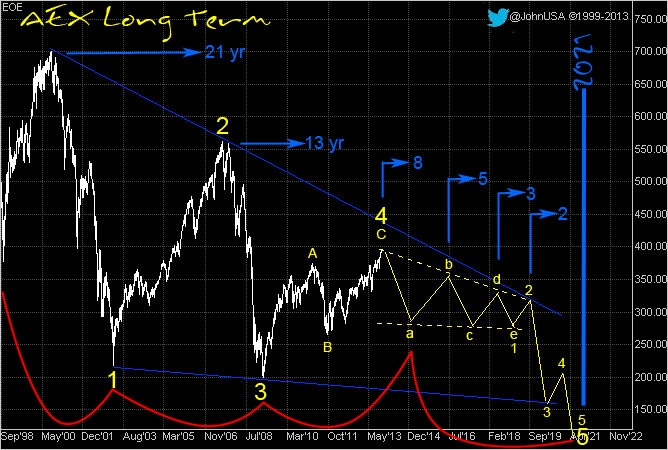
- AEX: End Game 2021Time for an update on the long term chart. The chart below is slightly adjusted from the June update, but the concept stays the same. Unlike the DOW Jones, which is setting all time highs at each…
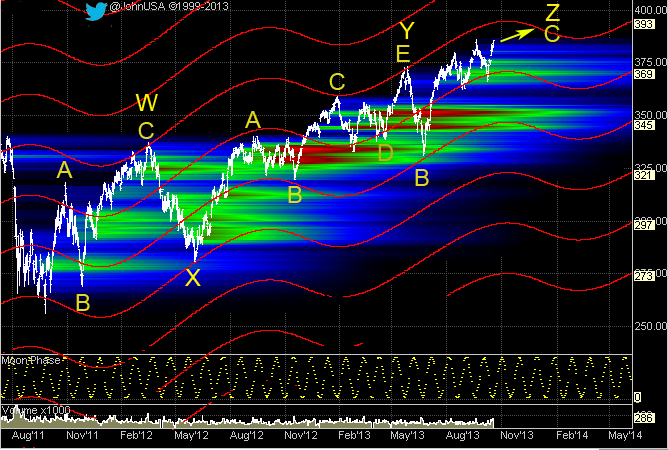
- AEX Short Term UpdateInteresting developments coming up in the AEX. Over the last few weeks we've seen increased volatility, related to news events such as the USA debt ceiling hoax and the government shutdown. But news…
- AEX Short Term UpdateWow, almost a month went by since the last update. That being said, the last update was on track and is still valid. Here's the image from that article: And here is the update for today: The AEX is…
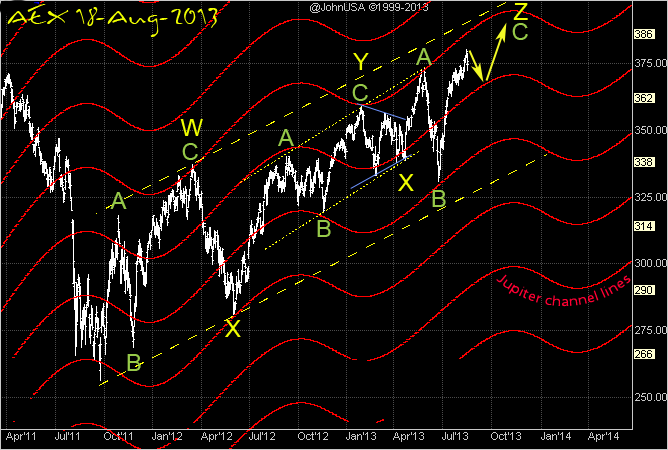
- AEX short term updateIt has been a while since the last update. Below is a snapshot from the June 14th update . This was a bullish alternative view, that at first did not seem to play out. But after a larger than…
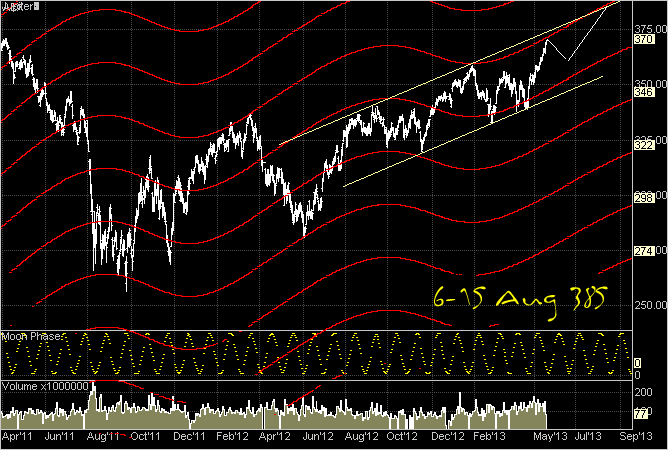
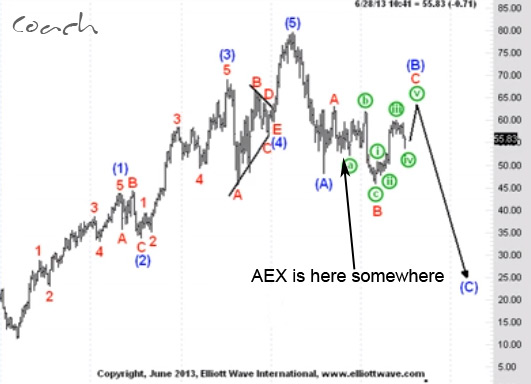
- Coach: leading indicator?Looks like luxury branch 'Coach' is a leading indicator for what's ahead for the AEX (and related indices). Top b circle end of July, dip B in Sept-Oct, and dip (C) in 2014. This saves me a lot of…
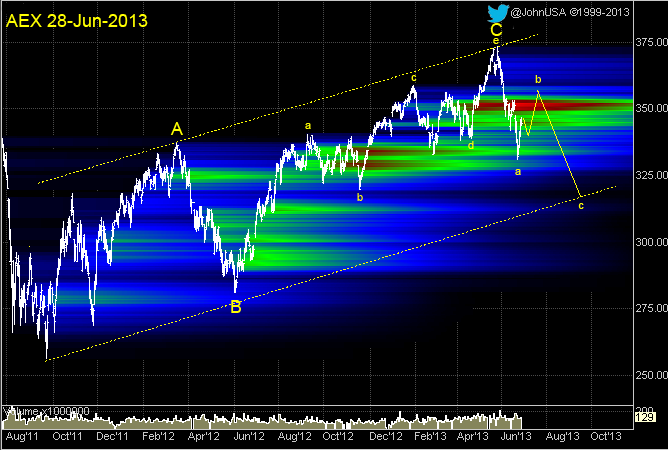
- AEX Long Term UpdateTo keep things in perspective it is good to keep the long term outlook in mind. I do this in this post. First a bit of short term. The AEX is currently retracing a decline. Over the next several…
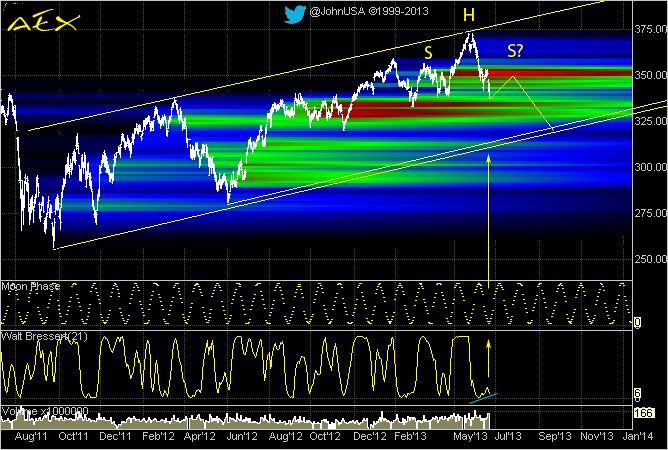
- AEX short term updateSo what's up? It's pretty clear by now that the peak (May 28th) is in. The decline is steep and currently oversold. I'm not a fan of overbought/oversold indicators, since they can stay in an extreme…
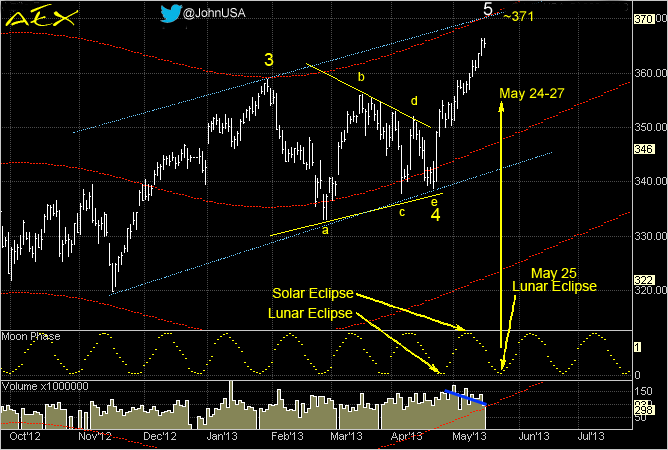
- AEX recap and outlookLet's do a little recap first. The chart below is from May 16. I projected a top around the May 25th eclipse because the following indicators all seem to come together: A complete Elliott wave count…
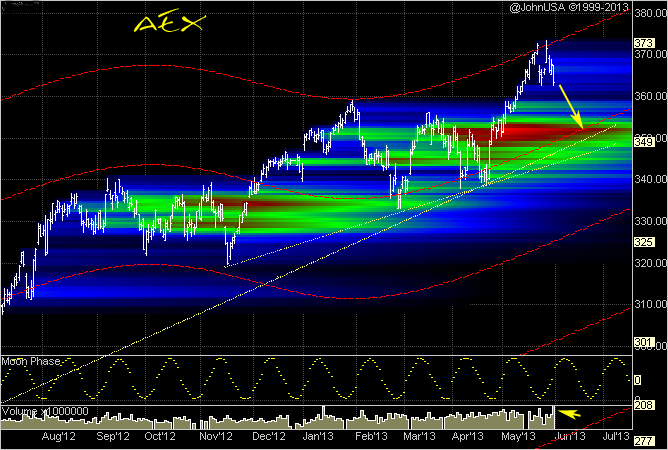
- AEX updateWhile the AEX decline since the May high looks choppy on the intraday chart, it can be subdivided and counted as 9 sub-waves. And 9 sub-waves is an impulse. If this assessment is correct, which I…
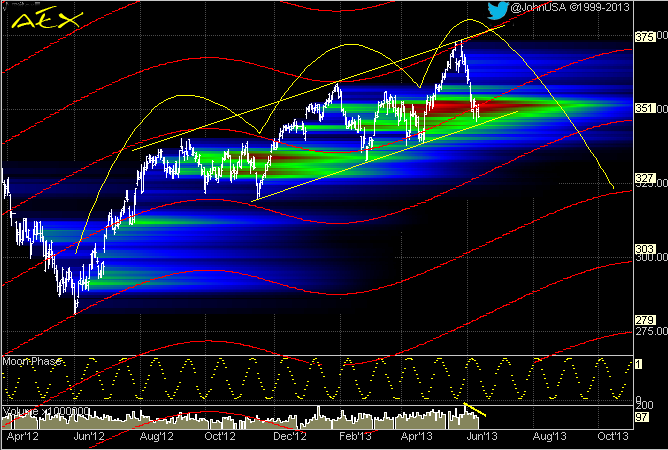
- AEX 348The 7 trading days since the top brings the AEX right at the previously projected first area of support. See image. While the decline looks straight on this chart (like an impulse) on the intraday…
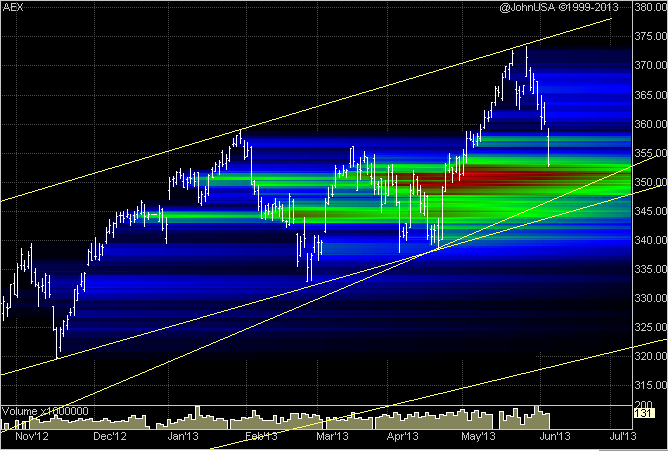
- AEX Short Term UpdateAs projected earlier, the AEX did indeed bounce of the upper Jupiter line (red) and is now on its way to the first support region, around 350-355. Fridays spike lower was on higher than average…
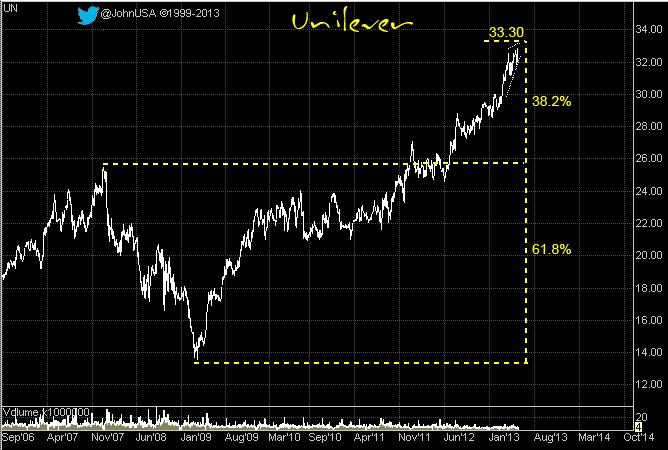
- Unilever Short Term UpdateIn the last Unilever article we wrote: Unilever is approaching a Fibonacci price relationship at 33.30. See chart. Unilever's uptrend is weakening. One indication of an ending diagonal is decreasing…
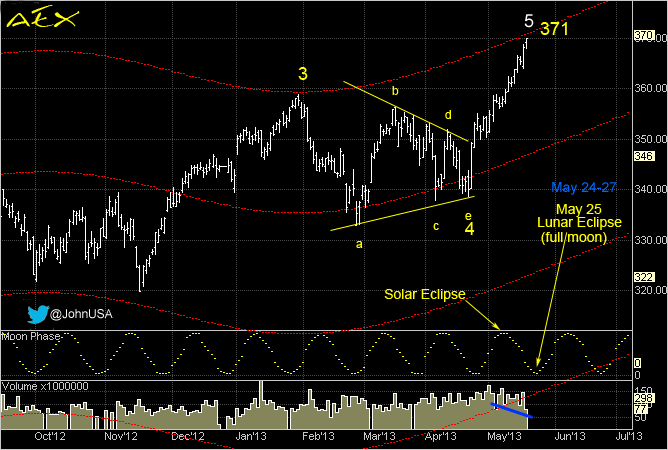
- AEX Alert: Possible TopThe AEX is 1 point away from the upper Jupiter channel line. This line is at 371 on Tuesday, slowly climbing to 372 on Friday. The AEX is in a similar situation as May 2012 where the Lunar Eclipse…
- Unilever Short Term UpdateUnilever is approaching a Fibonacci price relationship at 33.30. See chart. Zooming in (see chart below), Unilever's uptrend is weakening. One indication of an ending diagonal is decreasing volume…
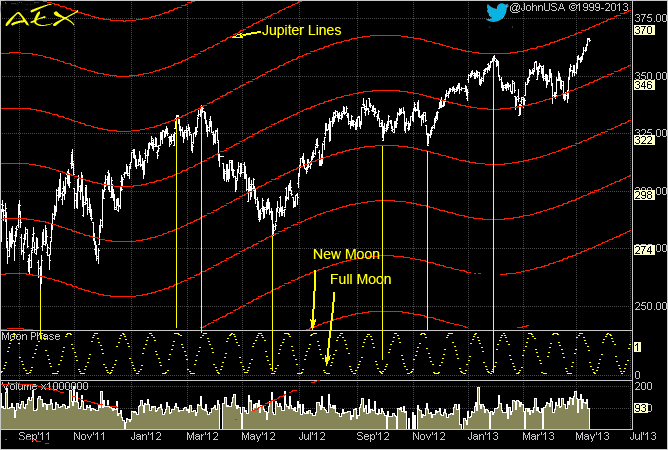
- AEX Moon Jupiter cycleAEX is approaching the next Jupiter channel line (red), that has been a good indicator of turning points in the past. See image below. Today the line stands at 370 and is slowly moving up to 371-372…
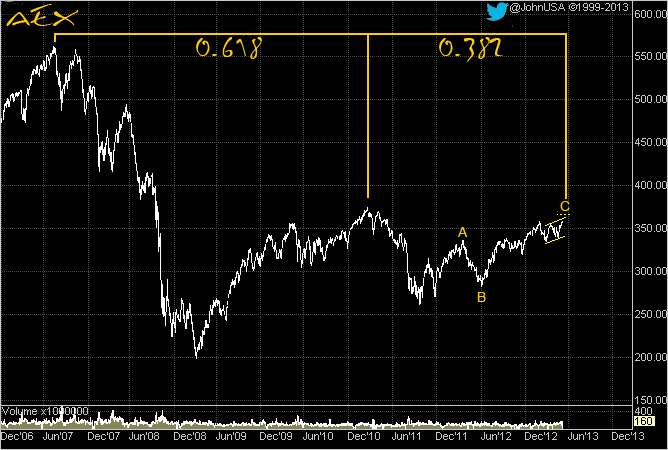
- AEX short term updateThe AEX is completing a large 3-3-5 Flat pattern according to the Elliott wave principle that started at the low in Feb '09. A large Fibonacci time ratio indicates a potential turn date at May 10th…
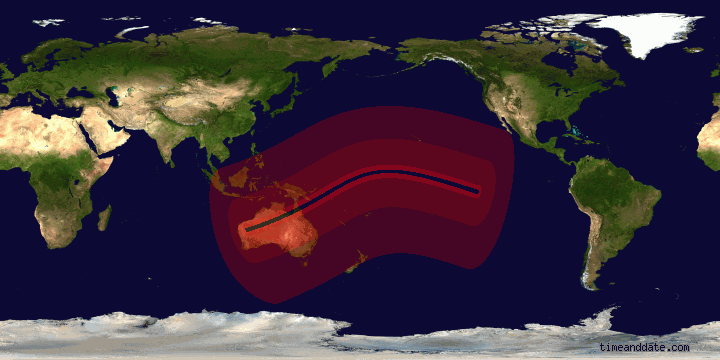
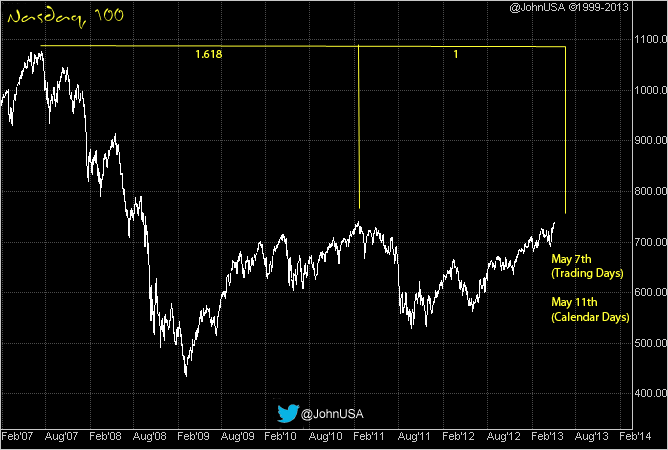
- May 9 – May 10, 2013 Annular Solar EclipseThe Nasdaq 100 index is now in a Fibonacci time frame between May 7th and May 11th. See chart. This coincides with a Solar eclipse on May 9 (May 10 in Europe). A good time to take some profits?
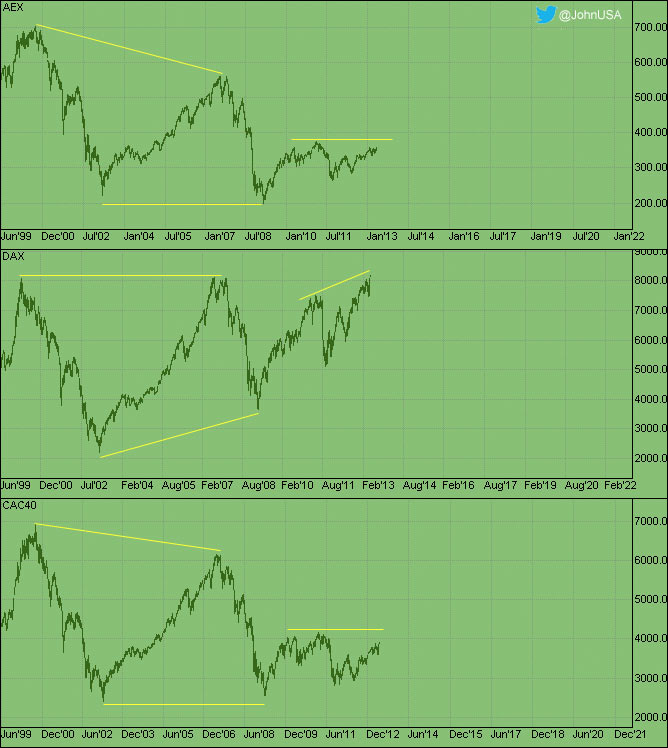
- AEX, DAX, CAC correlationAEX, DAX, CAC correlation It is still a common belief that the AEX follows the DAX. As I have been saying for years now, this is not the case. The AEX follows the CAC much closer than the DAX. The…
- Nasdaq 100 UpdateJust a quick note here. the Nasdaq 100 index might be entering a Fibonacci time frame between May 7th and May 11th. See chart.
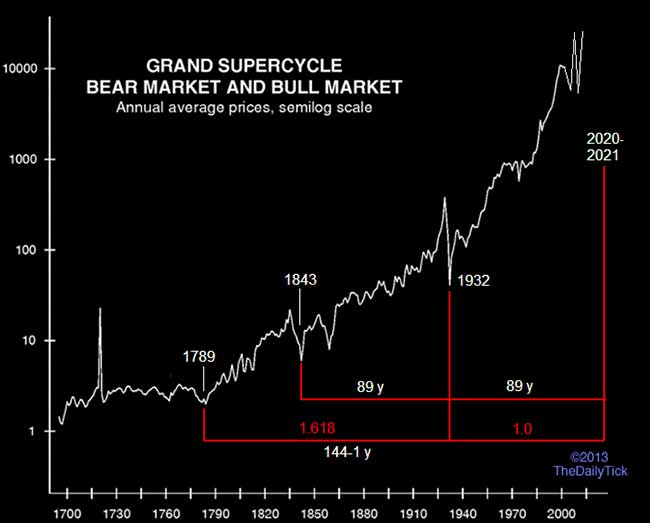
- DOW, 2018, 2021, the year of the OxDOW Jones Industrial & Fibonacci To look at important turning points in the market, it often helps to use Fibonacci time ratios. In the chart below I use a very(!) long term price chart. By taking…
- ING Long & Short Term UpdateThe AEX, once heavy on financial stocks like ABN, Aegon, Fortis and ING, today only has ING and AGN left. Of these only ING with a 11% weight in the index still counts as a heavy weight. So what's in…
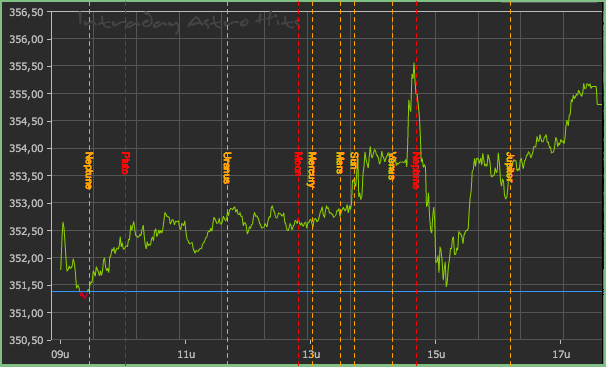
- The ECB, the Sun and NeptuneAs the ECB was announcing its interest rate decision, the Sun was transiting. As a matter of fact, the market started moving a few minutes before, right as the Sun 'hits'. Frontrunning? Also note…
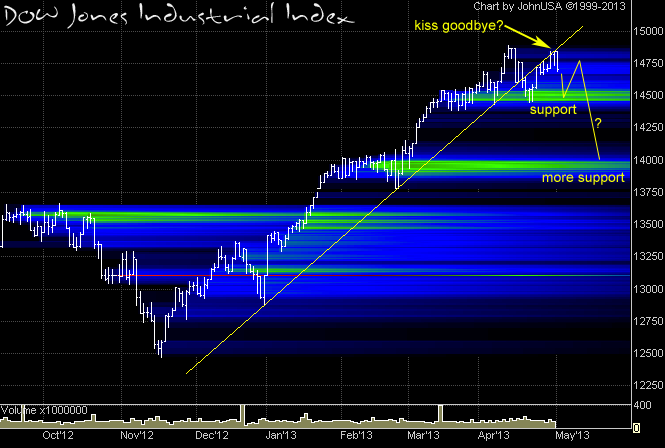
- DOW Jones UpdateThe support line from Dec 2012 first broke in April, then got retested. It hugged the trend-line for 6 straight trading days and now appears to be leaving it, the so called 'kiss goodbye'. The first…
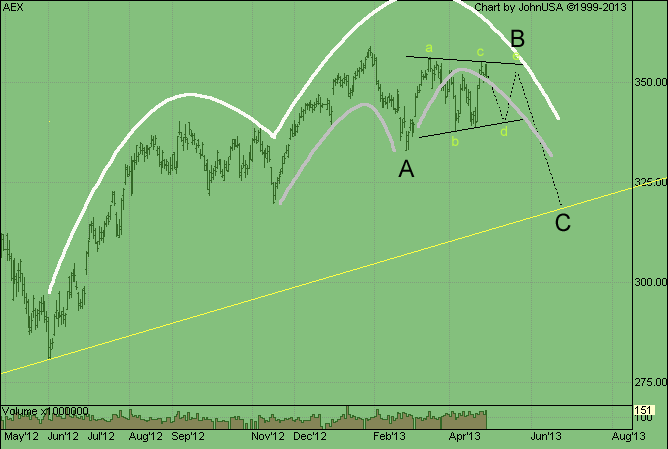
- AEX topping process and an alternate viewThe AEX is in a topping process. While the Elliott pattern calls for a new slightly higher high (360-365) as described earlier, the AEX appears to be stalling. If we combine this with the cycle…
- Arizona Central BankNo Update this weekend as I was doing some traveling. Along the way I found this photo opportunity...

- Surprise!Many 'gurus' seemed surprised by todays 9 point gain and scrambled to find 'news' to 'explain' this 2.67% rise. In my opinion news is the result, not the cause. By disregarding news and ONLY looking…
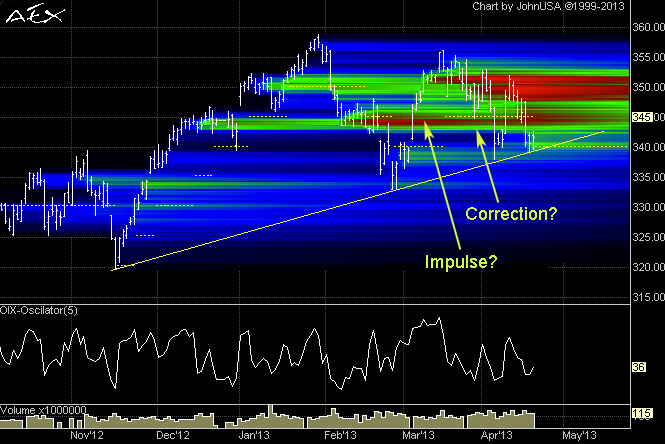
- Open Interest Index (OIX)This article explains what the effect of open interest is on options, and how we construct an indicator based on this data. This indicator was developed here and is called 'Open Interest Index' or…

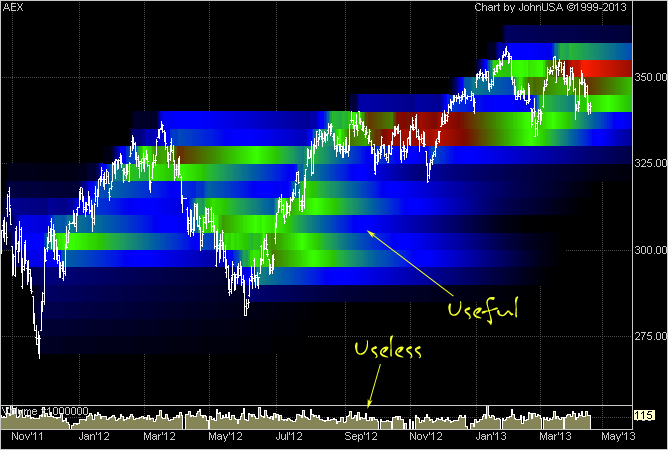
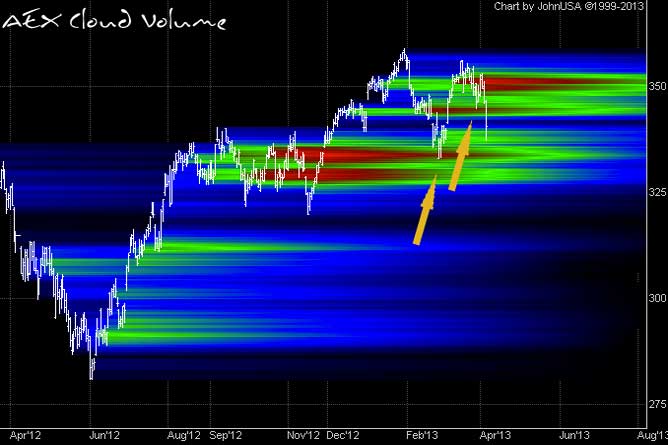
- Volume Cloud IndicatorHow to predict support & resistance levels using volume? Volume by itself contains too much noise to be a useful indicator, so several tools are available to make volume more useful: RoC (rate of…
- AEX Weekend UpdateThe AEX is still holding above the lower trend line. With the options expiration out of the way, the AEX is clear to pick direction. The USA indices were up on Friday (SP500, Nasdaq) while the DOW…
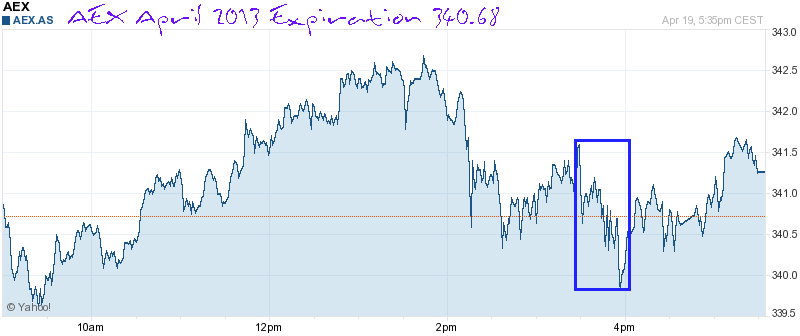
- AEX: April expiration was textbookIt's the Third Friday of the month, so the AEX/FTI options expired. The expiration period is from 15:30 to 16:00, after which the settlement price is set, which was 340.68. The optimal expiration…
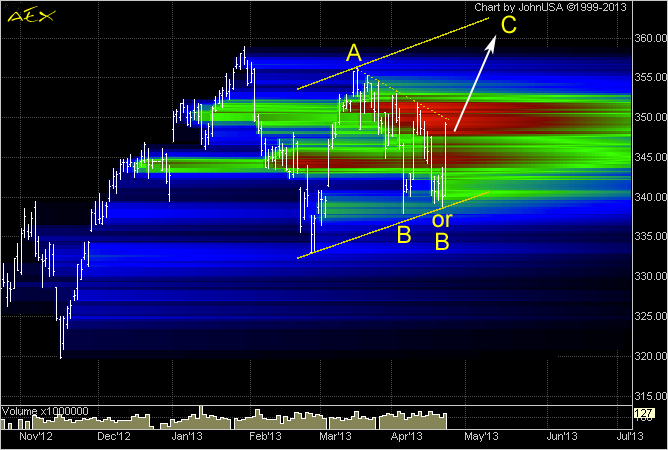
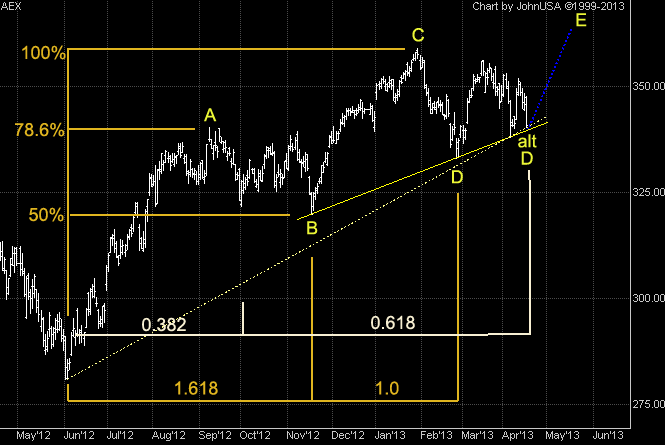
- AEX needs to bounce nowThe AEX counts best as an ABCDE ending diagonal that needs 1 more leg up. See the April 12 article . Wave D either ended in February or is ending right now, in which case wave D is a triangle…
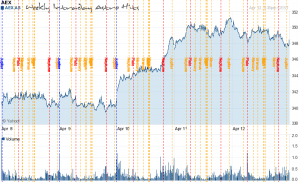
- This weeks Astro HitsThis chart shows all the 'astro hits' for the week as described here and calculated here . The colors indicate rising (blue), transit (orange) and setting (red). We already know that Jupiter is the…
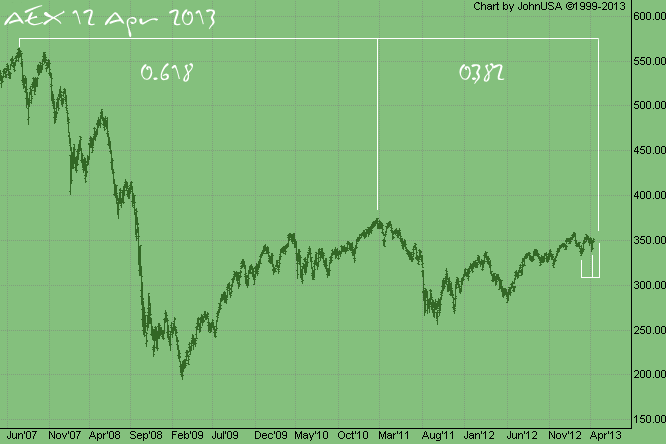
- AEX Short Term UpdateThe AEX is on its way to an important Fibonacci time relationship date. Note two important highs, 13-Jul-2007 and 18-Feb-2011. Using a standard 61.8% (golden ratio) and applying it to the 2 tops, we…
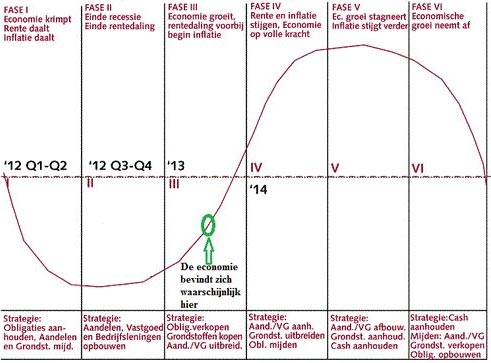
- Economic Sunshine?While Royce Tostrams might be a "market guru", there are 2 things he doesn't know anything about. Cycles & Cars. Let's start with cycles. He posted an article in the Dutch Financial Telegraph titled…
- AEX Short Term UpdateTo look at short term turn signals in the market, we can look at 'classic' technical analysis indicators such as RSI, CCI, Stochastics and Moving Averages. While they certainly can be useful, the…
- Hitting bottom, are we there yet?The short answer is "No", not by a long shot. As I have said earlier, I think the market will only bottom in 2021 and in this article I will explain why I believe that. To look at important turning…
- Mercury turns directTypically, the planets shift slightly eastward from night to night, moving slowly against the backdrop of stars. Sometimes, however, they change direction. For a few weeks/months, they will move west…

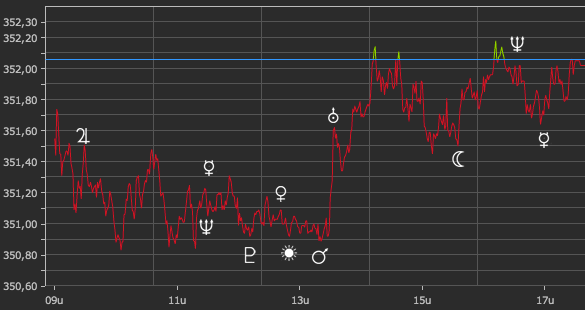
- Astro HitsIn financial astrology, planetary positions correlate to changes in the market. Certain positions and planets are more important than others. The most significant positions are the rising time, the…
- HousekeepingOver the next few weeks, we will be tweaking this site to improve its usability. As most web developers know, building a site takes 20% of the time, and then making it work on Internet Explorer takes…

- I'm back!It has been a long time since I talked about 'the market' in this format. When I started night-trading.com in 1997, the web was just starting to get popular and there weren't even many online brokers…